Workers comp
It's all good news…well, almost all
By Dennis H. Pillsbury
It’s not your father’s workers comp system any more. If it were, things would be even rosier. If workers comp were still primarily an indemnity coverage, then we’d be celebrating the continued drop in lost-time claim frequency with marching bands and fireworks.
According to data presented at the Annual Issues Symposium (AIS) of the National Council on Compensation Insurance (NCCI), indemnity represented 54% of total comp losses back in 1987. Twenty years later, indemnity accounts for only 41% of losses, according to estimates by NCCI for 2007 loss costs. And by now, medical costs have easily passed the 60% level. So, despite the fact that the workers comp industry enjoyed two of its best back-to-back years in 2006 and 2007, actually seeing underwriting profits in both of those years, the mood at AIS was cautiously optimistic, with just a hint of oh-my-goodness-what-if-competition-drives-down-rates-further.
The good news
In his report on the state of the line, NCCI Chief Actuary Dennis Mealy, FCAS, MAAA, pointed out that the underwriting results were strong, with the workers comp industry coming in with a combined ratio of 93% in 2006 and 99% in 2007. (Chart 1) “The 2007 calendar year combined ratio was the second straight year of underwriting profits for the line. In our search of the last 30 years or so of available history, we could find no other back-to-back years of underwriting profits for workers compensation,” Mealy said.
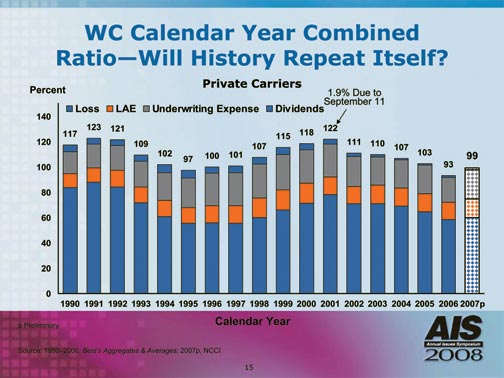 |
Chart 1 |
And this was accompanied by reserve strengthening that resulted in the industry being in “its strongest reserve position in over two decades,” Mealy said. The estimate for the reserve deficiency at year-end 2007 was $2 billion. “After consideration of the allowable discounting of the indemnity reserve of lifetime pension cases, the reserve position is full adequacy. This is in sharp contrast to the $21 billion deficiency at year-end 2001. Achieving reserve adequacy is one of the major accomplishments for the industry in the last five years.” (Chart 2)
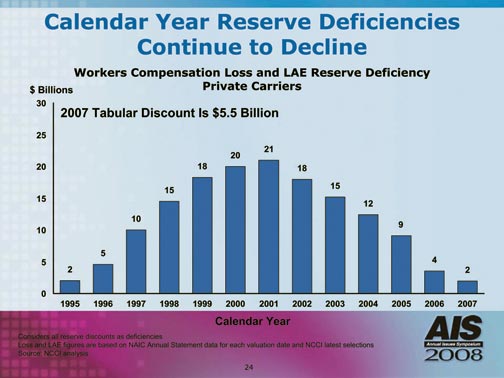 |
Chart 2 |
Contributing to the strong underwriting results is the continuing drop in lost-time claim frequency. The NCCI actuary pointed to a steady downward trend in work-related injuries due to improved working conditions. The trend shows that the rate of injury per 100 full-time workers fell from nearly 25 in 1926 to just above five in 2006. (Chart 3)
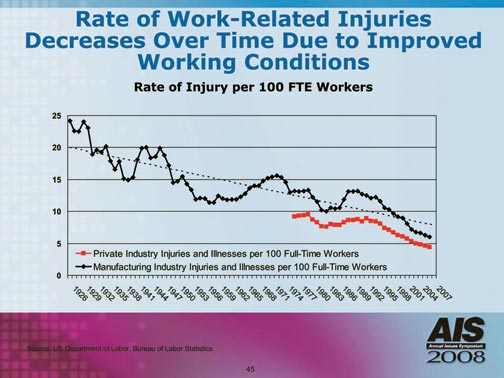 |
Chart 3 |
While some observers had opined that the decline in the rate of injury was the result of the change in the U.S. economy from primarily manufacturing to primarily services, Mealy pointed to a study by NCCI that found that the decline occurred across all industry groups and clearly is due to the overall safer work environment rather than a shift in industry concentra-tions. Declines ranged from a low of 14% from 2002 to 2006 for manufacturing and for miscellaneous industries to a high of 20% for office and clerical. (Chart 4)
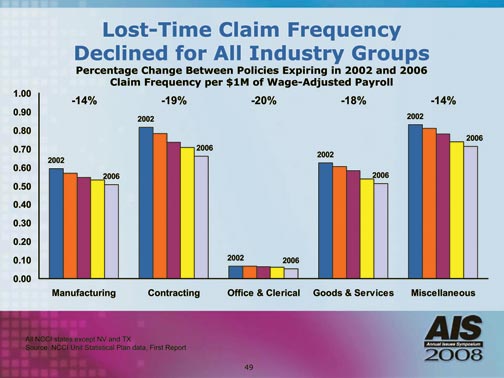 |
Chart 4 |
Mealy also noted two additional positive developments affecting the workers comp industry: the continuing depopulation of the residual market and the fact that the terrorism backstop was renewed for seven years.
And now for the bad news
While the underwriting results were quite good, Mealy noted that they needed to be since investment returns were well below historical averages, making it imperative that the industry continue to focus on an underwriting profit. (Chart 5) He also pointed to medical costs, which continue to rise faster than inflation. Workers comp medical claim costs have grown in every year since 1994 and reached $25.4 billion in total costs in 2007. (Chart 6)
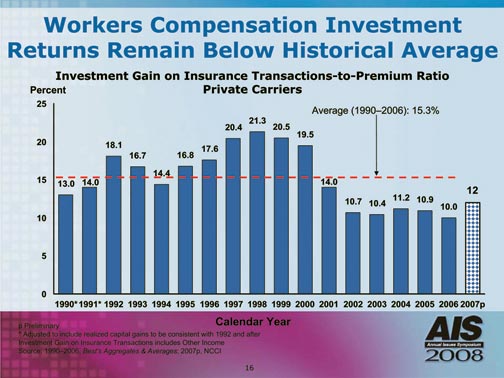 |
Chart 5 |
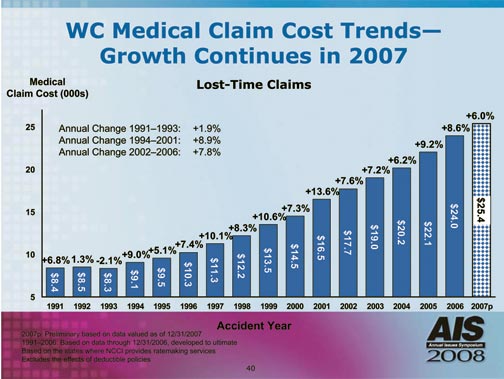 |
Chart 6 |
Another factor creating uncertainty in workers comp is the political climate. Because it impacts virtually every worker (seen as voters by those who enact legislation), workers comp is a politically sensitive line that regularly sees tinkering by state legislatures.
But the elephant in the room that no one really wanted to talk about is the soft market. Mealy noted that workers comp premiums declined in each of the last two years, dropping from $47.5 billion in 2005 to $46.3 billion in 2006 and $44 billion in 2007. (Chart 7) The length and depth of the soft market clearly will have an impact on workers comp results. The question is, Mealy noted, “Will history repeat itself?”
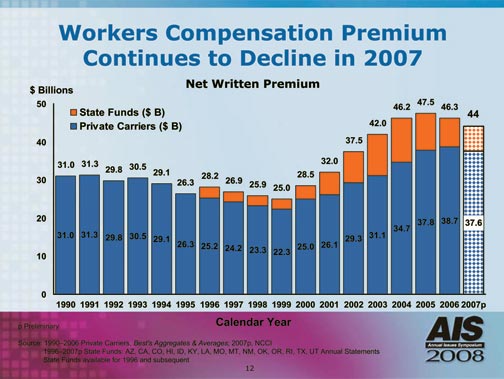 |
Chart 7 |
If it does, then the workers comp industry could be headed to combined ratios that flirt with the 120s. If the return from investments continues to lag, this could be serious indeed. Mealy concluded: “Our hope continues to be that low investment income and relatively stable loss costs will moderate this underwriting cycle compared to the last couple of cycles.”
However, atrabilious prognosticators, take heart. You can begin sharpening your pencils, dulled by reports on the subprime mess. There may yet be a dramatic downturn in the insurance market. *