 |
 |
 |
|
Building Equity Value Benchmarking personal lines service payroll What are the criteria? By Daniel E. Skowronski Agency owners often request benchmarks for employee compensation, typically seeking to correlate a specific position to a justifiable level of payroll. While in theory this approach is reasonable, in practice, the position itself should not be benchmarked. Instead, the focus should be on the performance of the employee in that position relative to the payroll. While much is said about performance-driven compensation systems, many agency owners and managers do not effectively correlate pay to the performance of service personnel. Often the misguided focus is caused by the lack of access to quality information or by allowing other issues to complicate the compensation analysis. This article will assist agency owners and managers in evaluating the performance of personal lines service personnel by using industry productivity and payroll benchmarks for clear guidance. As consumers, we have become accustomed to the idea that the price of a product or service should have some direct correlation to the benefit derived. You would likely be quite irate if you made reservations at a five-star restaurant, paid a five-star price, but received a fast food meal and experience. Conversely, when you pay $5 for a fast food meal, you don’t expect it to be a five-course dinner prepared by a gourmet chef. In general, we tend to believe that the higher the price (or investment), the higher the value (or return) we can expect. When working as intended, the free market model enables both the buyer and seller to understand the value of the product or service under consideration and to price it accordingly. The compensation/performance relationship with your employees is no different. The “price” you pay for their services should correlate in some way to the level of output and productivity they generate. Thus, as agency owners and managers, you need to examine the value received from the investment of payroll dollars into a particular person/position. The performance benchmarks used in this article are taken directly from MarshBerry’s Perspectives for High Performance (PHP) database. Among the hundreds of ratios and benchmarks contained in the PHP report, productivity ratios are generated for specific agency positions.
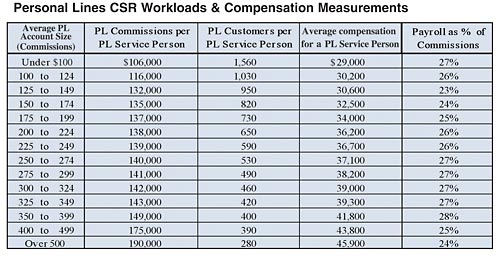
Given the diversity of captured data, numbers include agencies located throughout the United States, urban and rural, large and small, with personal lines service personnel having anywhere from no experience to several professional designations. The definition of service personnel includes those responsible in any capacity for the direct servicing of accounts, including claims personnel. As such, the industry benchmarks are indeed averages. The findings are presented in ranges, indicating that there is room for varying performance levels within an average, taking into account such factors as agency location, employee skill set and employee experience. The table on page 52 lists the benchmarks for personal lines service staff, which are sorted in terms of the average personal lines account size. Using the average account size as the barometer for comparison is a fair way to compare your staff “apples to apples” against the industry. The average account size has a significant impact on the level of commissions and customers that a personal lines service person can handle. A review of the industry benchmarks provides no real surprises and appears to make sense. For example, one would expect that a personal lines service person handling smaller, more commodity-driven accounts would maintain a lower total commission volume while servicing a relatively higher number of customers. It would also be reasonable to expect that servicing such accounts would correlate to lower pay. Moving down the table, it is evident that the larger the average account size, the more commission dollars handled per personal lines service person, the lower the number of accounts they maintain and the higher their compensation. However, it is interesting to note the percentages in the far right column of the table, which shows the average payroll as a percentage of the commissions handled for each account size. This percentage decreases as the average account size increases, but only up to an average account size of $150, after which it begins to increase again. This percentage does not begin decreasing again until an average account size of $400 is reached; then it drops rather quickly. Agencies with an average personal lines account size between $125 and $199 and above $400 achieve some gain in their bottom line since productivity relative to payroll is the highest. In no way does this suggest an optimum average personal lines account size, but it does show where the “value” of the invested payroll dollars is highest. Agency owners and managers also must consider additional factors that can bear on a compensation analysis, such as the difficulty of finding qualified staff, the level of other benefits provided to employees, geographic location, etc. Certainly it is valid to consider such factors when making compensation decisions. However, these additional considerations should be deemed valid only if the employee and agency can leverage them into greater results (higher productivity) than are achieved by individuals without the same particular attributes. Are you ready to assess your personal lines service staff by analyzing their productivity and understanding how the performance generated from your investment in payroll stacks up against the industry? To perform your own analysis, examine each service person and identify the average account size within the book he or she handles. Next, compare productivity levels in terms of the number of customers and amount of commission dollars each service person handles. Keep in mind that there are limits to what even a highly qualified and productive service person can handle. While compensation decisions cannot be made based on numbers alone, the above analysis should provide one more piece of information to help you make quality decisions. * The author |
|
||||||||||||||
| |||||||||||||||