 |
 |
 |
|
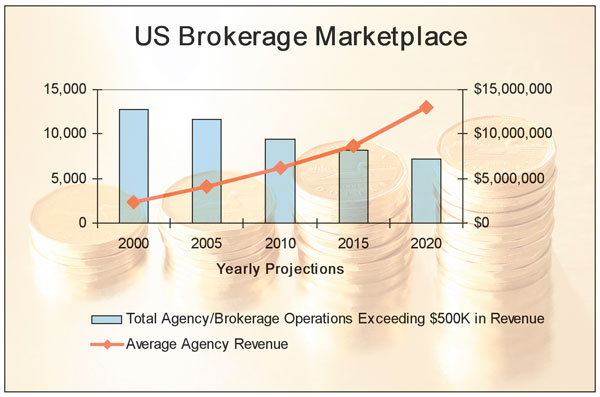
Building Equity Value Benchmarking your balance sheet Collection ratios and equity ratios guide agency owners in fortifying their finances By Wayne A. Walkotten The everyday financial choices made by agency owners and their impact on the agency’s equity ratios will largely determine the future viability of the agency. Those who make the right choices will be afforded opportunities for growth, while those who fail to shore up their balance sheets may be victims of continuing consolidation. A strong balance sheet provides the capital necessary for continued agency reinvestment in people, processes, and technology. To be survivors, agency owners must understand the balance sheet benchmarks that are critical to perpetuation. The graph below illustrates the shrinking agency plant and the increasing size of the average agency as small agencies slowly disappear. Agencies often disappear due to lack of discipline in growing their agencies and succumbing to the pressures of insurance companies’ tiering and larger, more profitable competition. Many fail to recognize that they can control their destiny by developing and improving collection practices and strengthening balance sheets. The performance benchmarks utilized in this article are taken directly from MarshBerry’s Perspectives for High Performance (PHP) database. The ratios discussed in this article fall into two critical categories: collection ratios and equity ratios. For simplicity, please note that we are using general averages of various sized organizations, from different geographic locations, maintaining different line of business mixes. As with any benchmark, the goal is to understand the story behind the numbers. Agency executives need to calculate their agency’s metrics, compare their numbers to the averages, question current practices, understand the rationale for any differences, and make changes where appropriate. We challenge you to keep an open mind and question how these metrics apply to your organization versus rationalizing why they may not. Average collection period (days) Many agents cannot believe the benchmarks for Average Collection Period (# of days in the period divided by accounts receivable turnover). This ratio for the average agency is 17.7 days, while for the Best 25% it is a startling half-day. This low number surprises many agents, but it is not an anomaly. Many agencies of different sizes average in the low single digits, and some even have a negative average. Ratios like these can be achieved by focusing on the following disciplines: • Diligent use of pre-billing and binder billing • Communication of credit expectations to clients • Consistent follow-up on all billings in excess of 30 days • Timely cancellation of those that violate your policies No client should be allowed to exceed 45 days, as these amounts are now due to insurance companies. Cash management An agency should attempt to maximize the interest it earns on agency float and minimize the cash it pays on customer float. Agency float is the temporary cash pool created when payables exceed receivables. Since this cash difference has been collected from customers but not yet paid to insurance carriers, it should be available for temporary investment. Customer float is the cash drain an agency experiences when it must advance funds to its carriers on behalf of customers whose accounts receivable have aged beyond 60 days. In essence, the customers are floating on agency cash, and the agent must borrow this money from the agency float, working capital, retained earnings, or a bank. In any event, potential investment income is lost. The Cash Management Ratio is determined by the formula above. It should be noted that the above metric uses 60 days as the baseline because most agencies still use a 30-60-90 day tiering system for receivables aging. More proactive agencies, and typically better collectors, use a 15-30-45 tiering system for their aging. The days when agency management would only start worrying about accounts that hit 90 days are gone. By 90 days, the account is already 45 days past due. Sometimes this is due to a customer lack of payment. But often this is due to “internal delinquencies” within the invoicing and collection processes. A ratio over zero is the percentage of float from insurance companies that is currently on loan to customers because the agency has already paid the insurance company on their behalf. The average of this benchmark is approximately 0.35, while the Best 25% of the agencies in our PHP database report zero, which means they essentially do not have any balances over 60 days. Agencies having high (poor) cash management ratios and little working capital are in great peril. The suggestions listed earlier for improving the Average Collection Period apply to this ratio as well. It should also be noted that many agencies find it successful to have accounting personnel responsible for collections, while others still make producers responsible for good results. The one thing better performing collectors have in common is the fact that someone is held accountable on a consistent basis, and it doesn’t matter whether it is the producer or the accounting department. Trust ratio The Trust Ratio measures the funds available to the agency in excess of amounts owed to insurance companies, giving the agency a barometer of its cash position. The ratio indicates the number of times an agency could pay insurance companies based on the cash, marketable securities, and accounts receivables in its balance sheet as of the measurement date. The Trust Ratio is determined by the formula at left. It should be noted that, for this ratio to be meaningful, agencies must reconcile their insurance company payables to the detail of accounts owed insurance companies. Many agencies do not know exactly what they owe insurance companies, because they lack the discipline to follow up on omitted items and differences in a timely manner. If an agency’s balance sheet is comprised of fixed assets, notes receivable from owners, and intangible assets, agency management may start to learn that they have a poor working capital position. The average agency has a Trust Ratio of 1.74, which indicates the agency has 0.74 times its insurance company payables in excess funds, after payment to insurance companies. The Best 25% have 3.75 times the insurance company payables in excess funds. Do not be misled by the Average, however, as many agencies have balances that are significantly short of their insurance company payables. Important suggestions for improving the Trust Ratio include the following: • Do not dip into agency float to pay expenses, especially owner compensation and perks. • Do not pay bonuses in April, out of this year’s contingent income, as the year is only one-third complete and several major renewal dates are still to come. • Have an annual budget or, better yet, a rolling 12-month budget. • Do not borrow from the agency. If the agency cannot afford to pay bonuses, it should not make loans to the owners. Working capital defensive interval (days) The Working Capital Defensive Interval is a further measure of an agency’s ability to pay its insurance companies and bills as they come due. The Working Capital Defensive Interval is determined by the formula above. One way to think of the Defensive Interval is that it measures the number of days that an agency can cover expenses if all revenue streams came to a halt. The Average agency had a measure of 49 days, while the Best 25% had an average of 172 days, or almost 6 months. The Defensive Interval provides agency management with a benchmark of its liquid balance sheet and the ability to meet day-to-day expenses. Note that this ratio does not give credit for fixed asset investments, loans to shareholders, or the agency’s past investment in intangible assets because these items cannot be easily turned into cash. Tangible net worth ratio The Tangible Net Worth ratio measures the tangible balance sheet of the agency in relationship to its revenue. As an agency’s revenue grows, it is very important that its balance sheet grows in proportion to it. The Tangible Net Worth Ratio is determined by formula above. This measure subtracts intangible assets from the assets and the net worth of the agency, as the intangible assets are not available for day-to-day needs or long-term investment. The average agency has a Tangible Net Worth ratio of 0.12, which indicates that the value of the balance sheet is equal to 12% of its revenue. On the other hand, the Best 25% agencies have a Tangible Net Worth ratio of 0.46 times of revenue. We recommend a Tangible Net Worth ratio of 0.20, or 20% of agency revenue. If an agency is preparing for a perpetuation transaction, it should be building toward a ratio of 0.25. The most important step an agency can take to improve this ratio is to plan for the future with regard to acquisition planning, perpetuation, and debt financing. It is critical that all agencies understand the impact of their decisions on Tangible Net Worth, which is essentially their “rainy day fund” and available not only for the investments mentioned above, but also to insulate the agency from the loss of major accounts, producers, or insurance companies. Summary The balance sheet is an integral component of agency value and long-term sustainability. A strong balance sheet provides for the capital needed to reinvest in people, processes, and technology. It mitigates the risk associated with a fluctuating income statement. Strong collection practices maximize cash while minimizing writeoffs. Balance sheet benchmarking: Calculate. Compare. Question. Understand. Change. The balance sheet is important. Ask any agency owner who sold. * The author |
|
|||||||||||||
| ||||||||||||||